When Small-Cap Breadth Collapses: A Look at 13 Prior Episodes Since 2018
Published
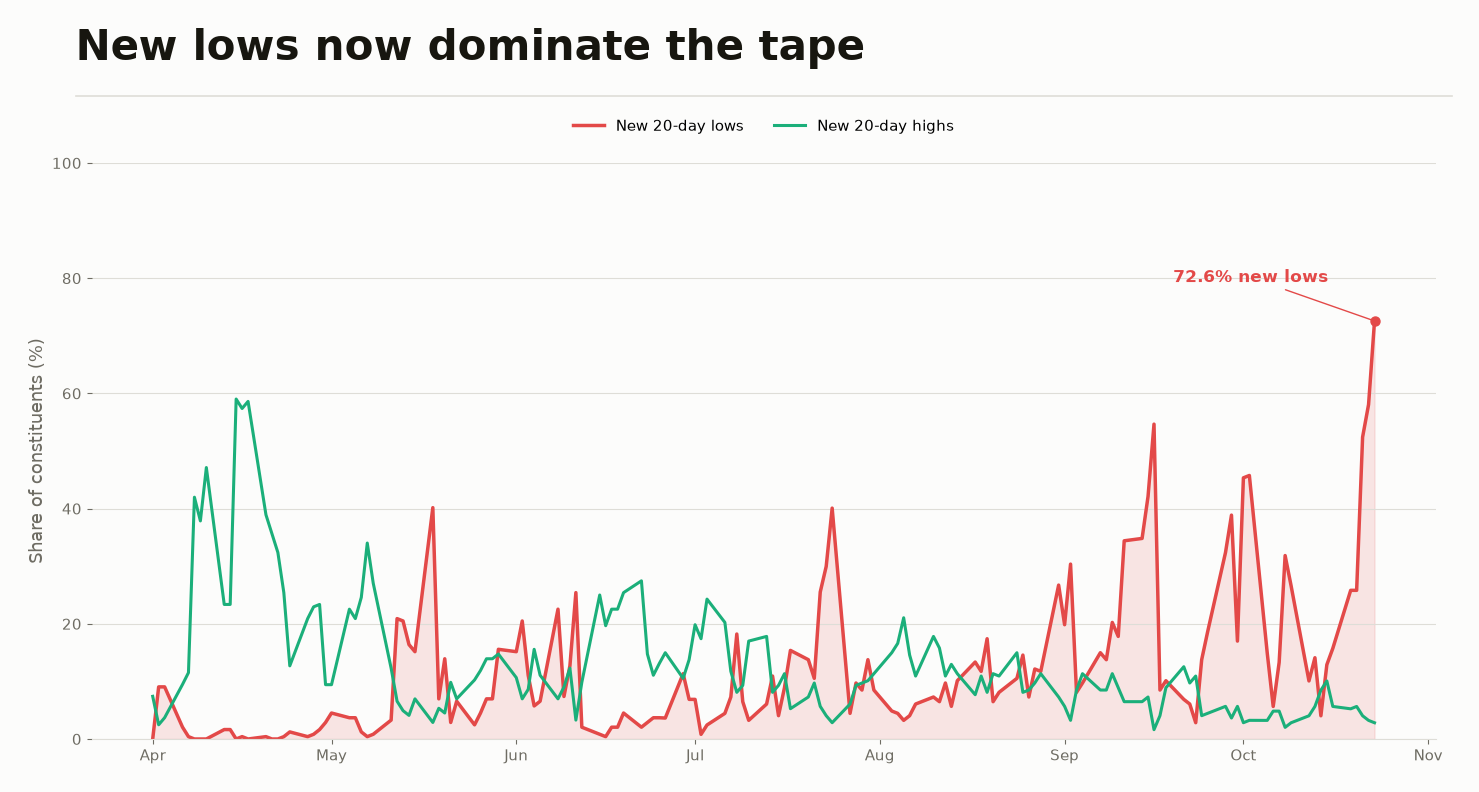
Small-cap breadth has fallen off a cliff this financial year. On 23 October 2026, only 9.3% of the Nifty Smallcap 250's constituents were trading above their own 20-day moving average, down from 42.0% at the start of FY2026-27 in April. Over the same stretch, the share of names hitting a fresh 20-day low jumped to 72.6% — nearly three out of every four stocks in the index.
Numbers like that invite an obvious question: has this happened before, and if so, what came next? We went back through the data to find out.
What “breadth” means here
Breadth is simply the share of stocks in an index trading above their own moving average — a 20-day average smooths out daily noise to show the short-term trend, a 200-day average shows the longer one. When breadth is high, most stocks are participating in a rally. When it's low, most stocks have already broken down, even if the index itself still looks fine on the surface — breadth often weakens before price does, since it's picking up stress across the whole market rather than just the handful of large names that dominate a cap-weighted average.
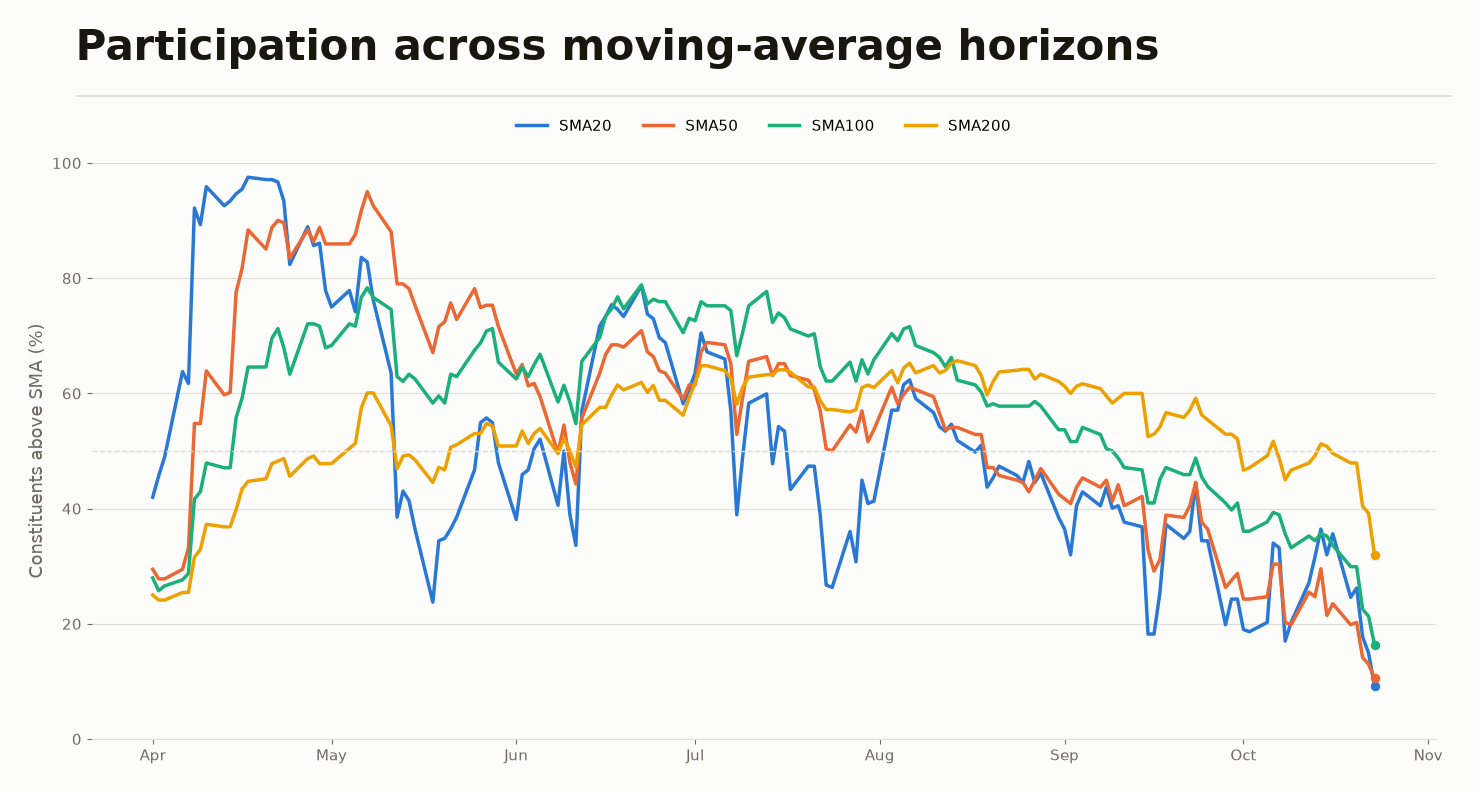
The pattern this year is uneven across horizons. Short-term breadth has collapsed: the 20-day measure fell 32.7 percentage points and the 50-day measure fell 18.9 points. The 100-day measure is down 11.6 points. But the 200-day measure — the slowest, most structural read on the index — is actually higher than it was at the start of the year, up 7.0 points to 32.0%. That combination usually describes a sharp, recent selloff landing on top of what had been a reasonably constructive longer-term base, rather than a market that has been grinding lower all year.
Has this happened before?
We built a daily breadth history for the same 248-name universe back to April 2018 — the earliest point where the current Nifty Smallcap 250 constituent list had usable price coverage for at least half its members — and looked for every prior instance where 20-day breadth fell to 13% or below while new-20-day-lows spiked past 60%, the same joint condition reached this October. Consecutive qualifying days were treated as one episode rather than counted separately.
That search turned up 13 completed episodes since 2018. For each one, we measured the forward return of a daily-rebalanced, equal-weighted basket of the same 248 names, starting from the single worst day of the episode.
| Horizon | Mean return | Median return | Positive hit-rate |
|---|---|---|---|
| +5 trading days | +1.3% | +3.8% | 69% |
| +10 trading days | +1.2% | +2.1% | 77% |
| +20 trading days | +3.8% | +4.8% | 69% |
| +40 trading days | +5.1% | +4.2% | 77% |
| +60 trading days | +8.5% | +5.5% | 92% |
The pattern across these 13 episodes is that recovery, where it came, mostly didn't arrive immediately. The 5- and 10-day numbers are modest and mixed — a trough in breadth was not a reliable short-term bottom. By 60 trading days, though, 12 of the 13 episodes were positive, averaging an 8.5% basket return.
How this October compares
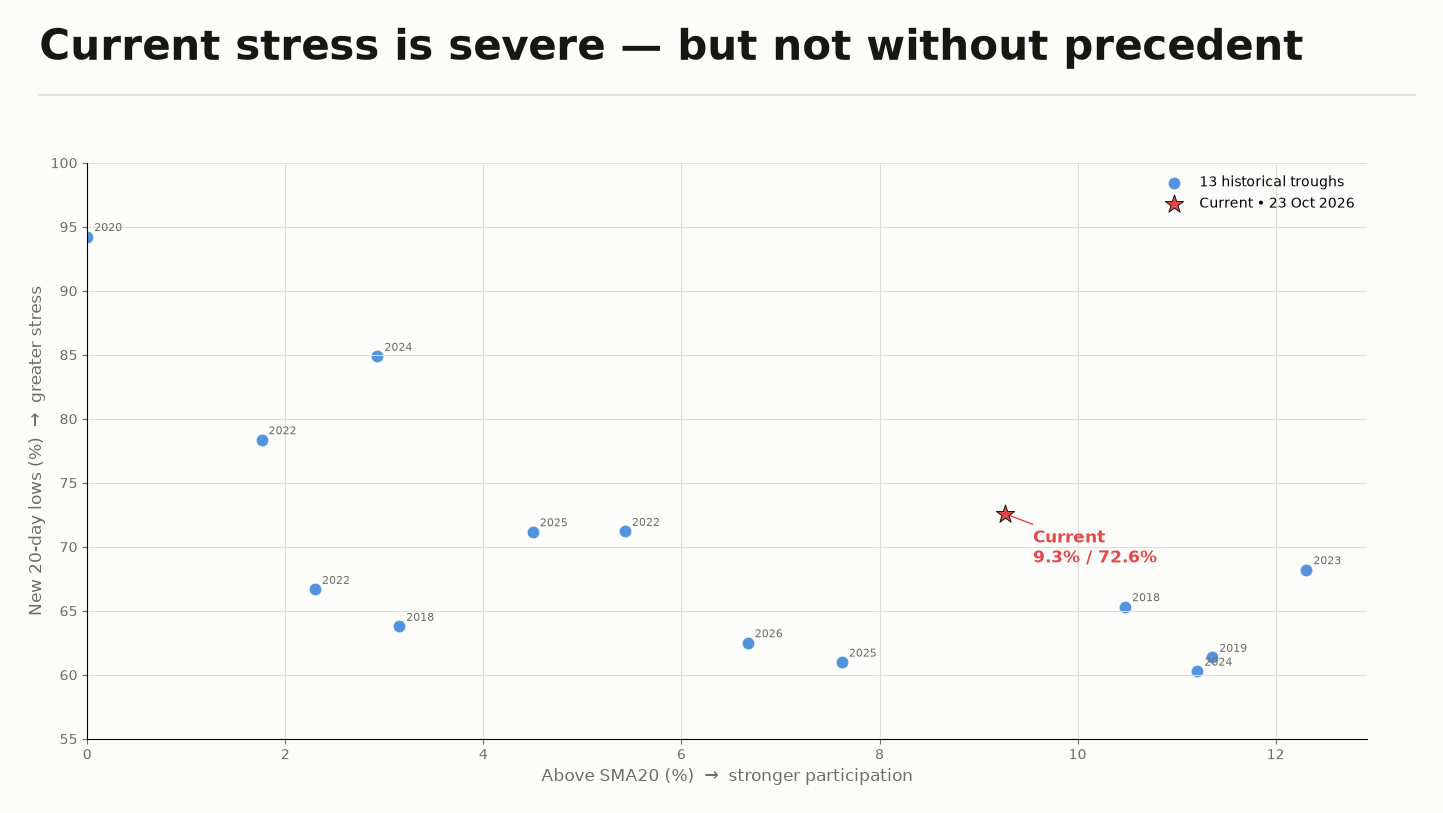
Measured against those 13 historical troughs, the current reading ranks 10th-lowest on 20-day breadth and 4th-highest on the new-low spike — a genuinely severe joint reading, but not the most extreme on record. Three prior episodes (March 2020, February 2022, March 2024) were worse on both measures simultaneously. The March 2020 episode is a useful reminder of how this can go: breadth hit a comparable extreme, and the basket still fell another ~21% over the following two weeks before it actually turned.
What this isn't
A few honest limits on this analysis, worth stating plainly rather than leaving implicit:
- Survivorship bias. The study applies the current 248-name constituent list retroactively across the full 2018–2026 window. It does not reconstruct which names were actually in the index at each point in history.
- Small sample. Thirteen episodes is a small number for drawing statistical conclusions, and they are not fully independent of each other — a few of them cluster around the same macro shocks (the 2020 crash, for instance). A couple of large rebounds can move the average more than the underlying pattern might justify.
- No bottom call. This history shows that oversold breadth readings have historically been followed by positive returns over a 60-day horizon more often than not. It does not show that the current episode has bottomed, and there is real historical precedent (2020 especially) for breadth to deteriorate further before it turns.